All over the world, businesses and organizations are swimming in enormous amounts of data. This forces thousands of organizations to find new ways to collect, curate, visualize, and analyze data. To meet the growing demand of analytical skills and talent, faculty at the Berkeley College Larry L. Luing School of Business are designing tech-empowered experiential learning initiatives to bridge the disconnect between the demands of the real world and the higher education system.
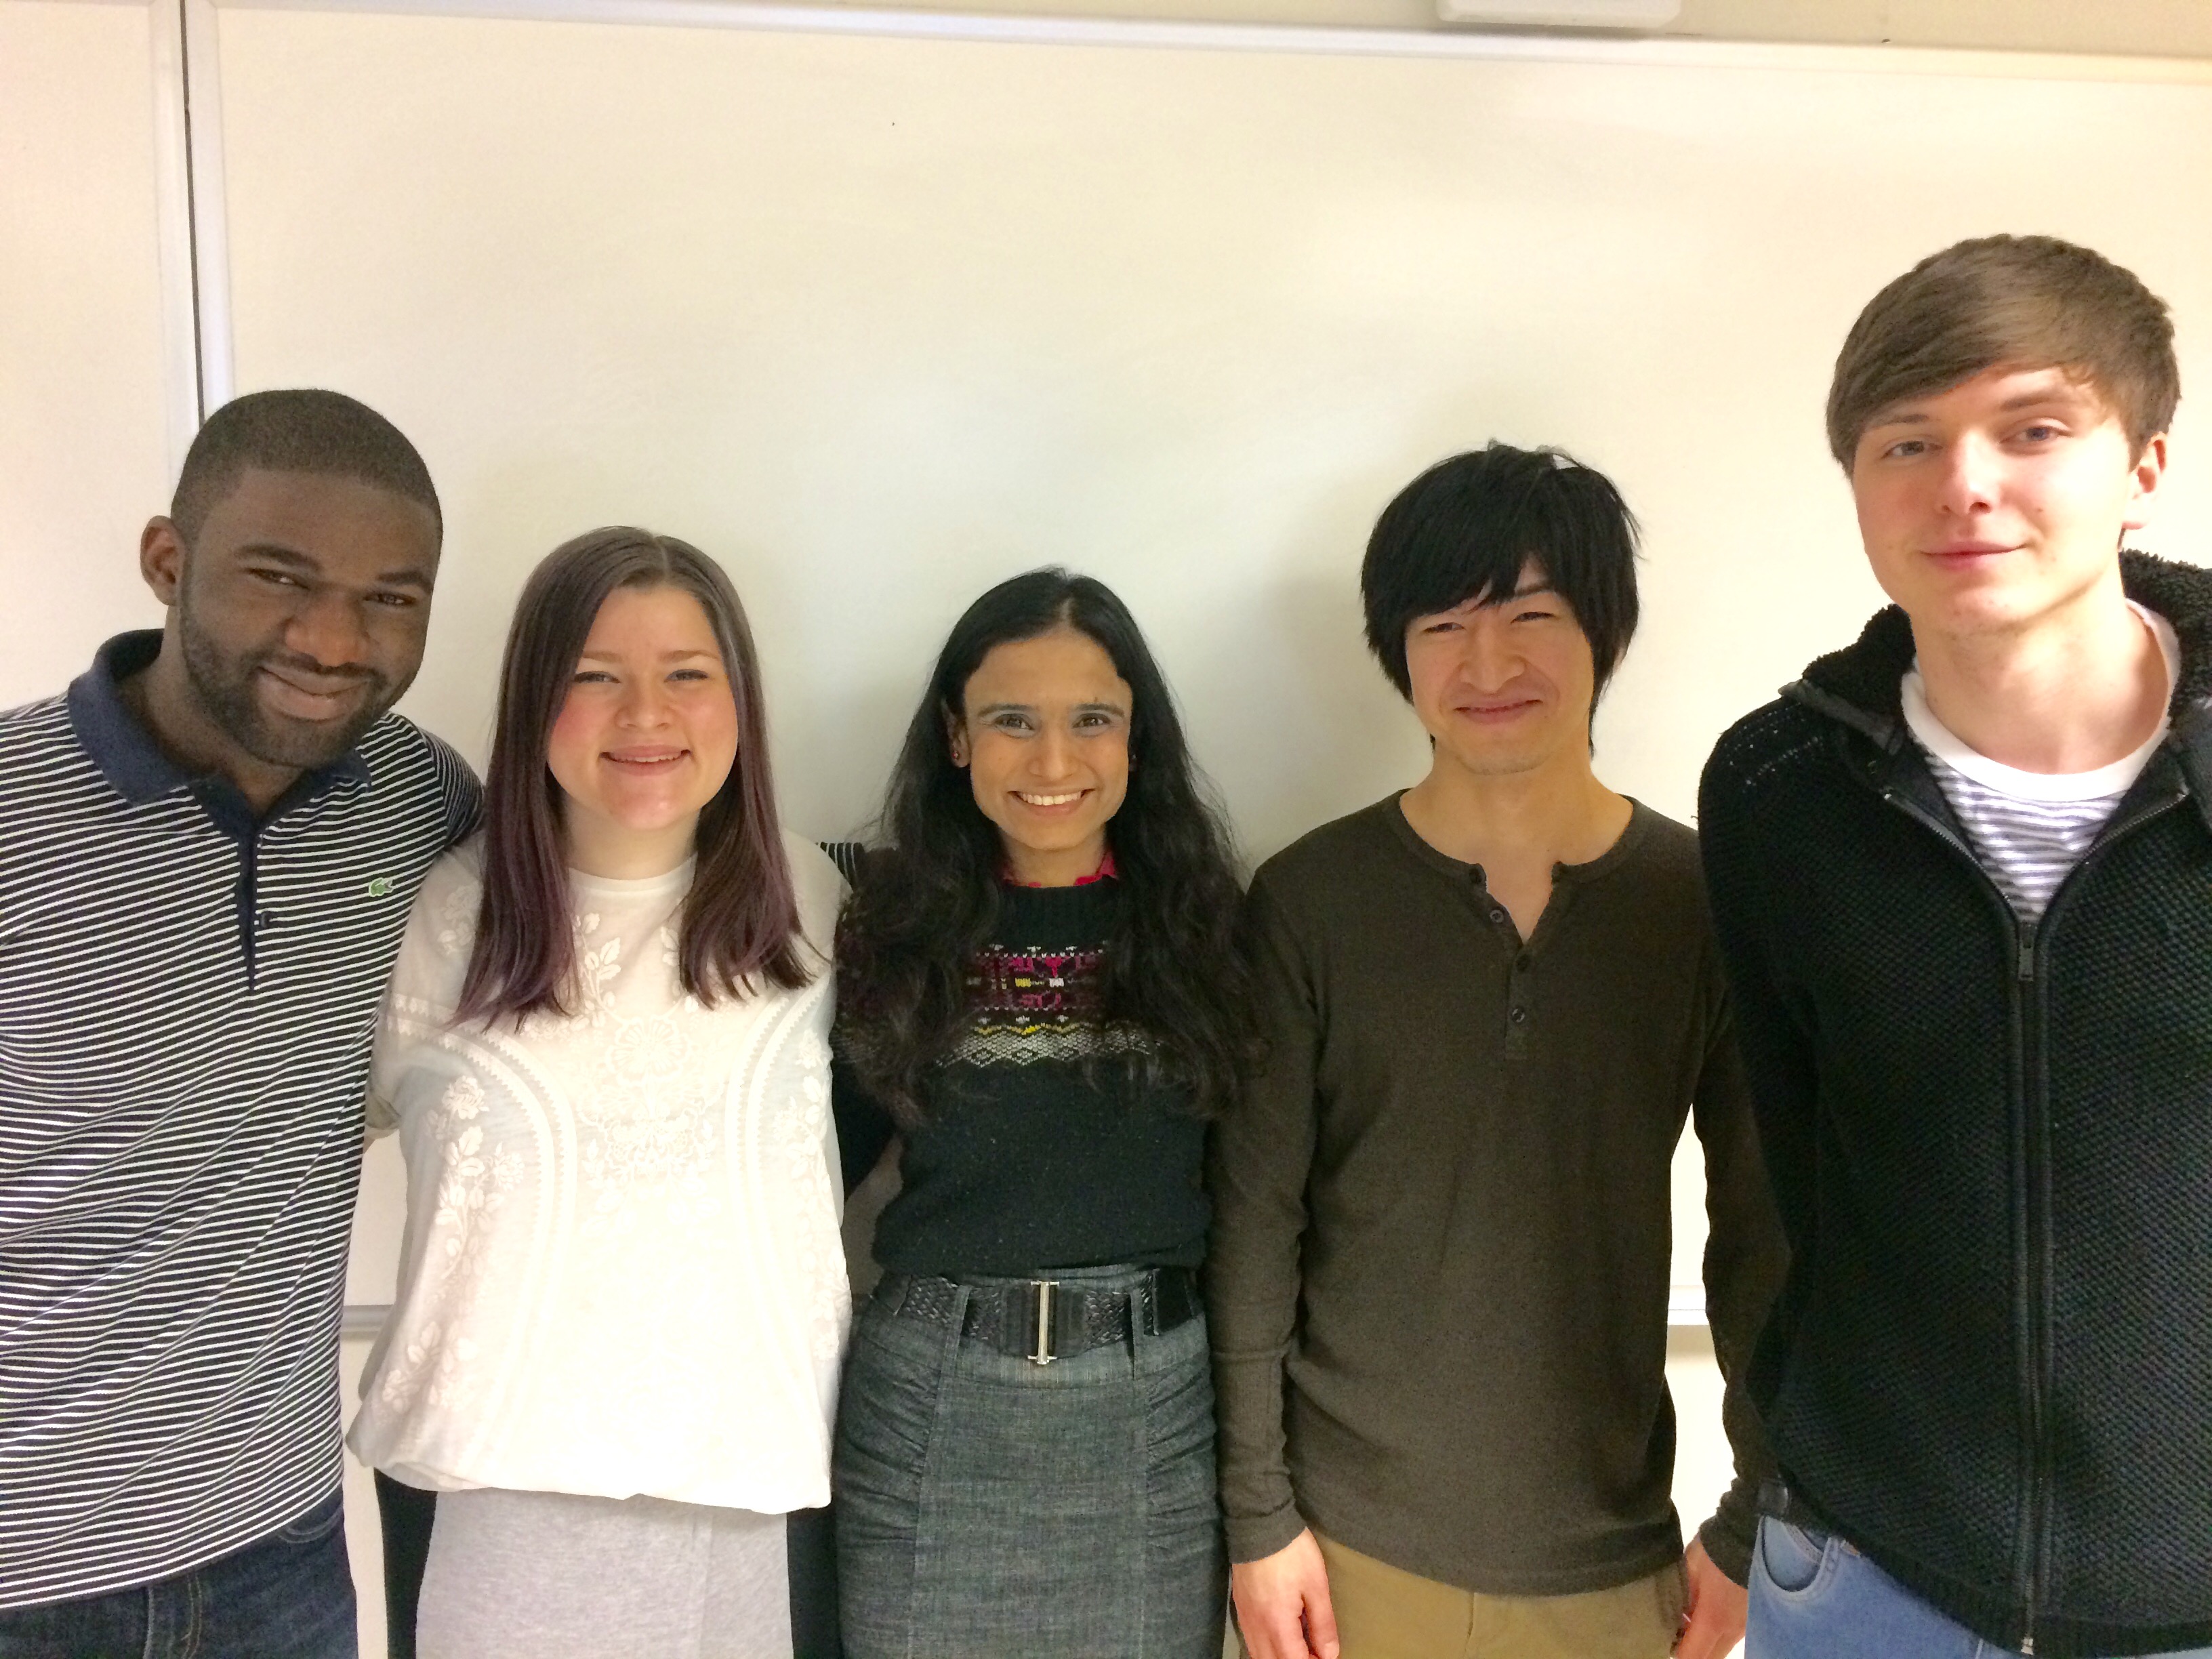
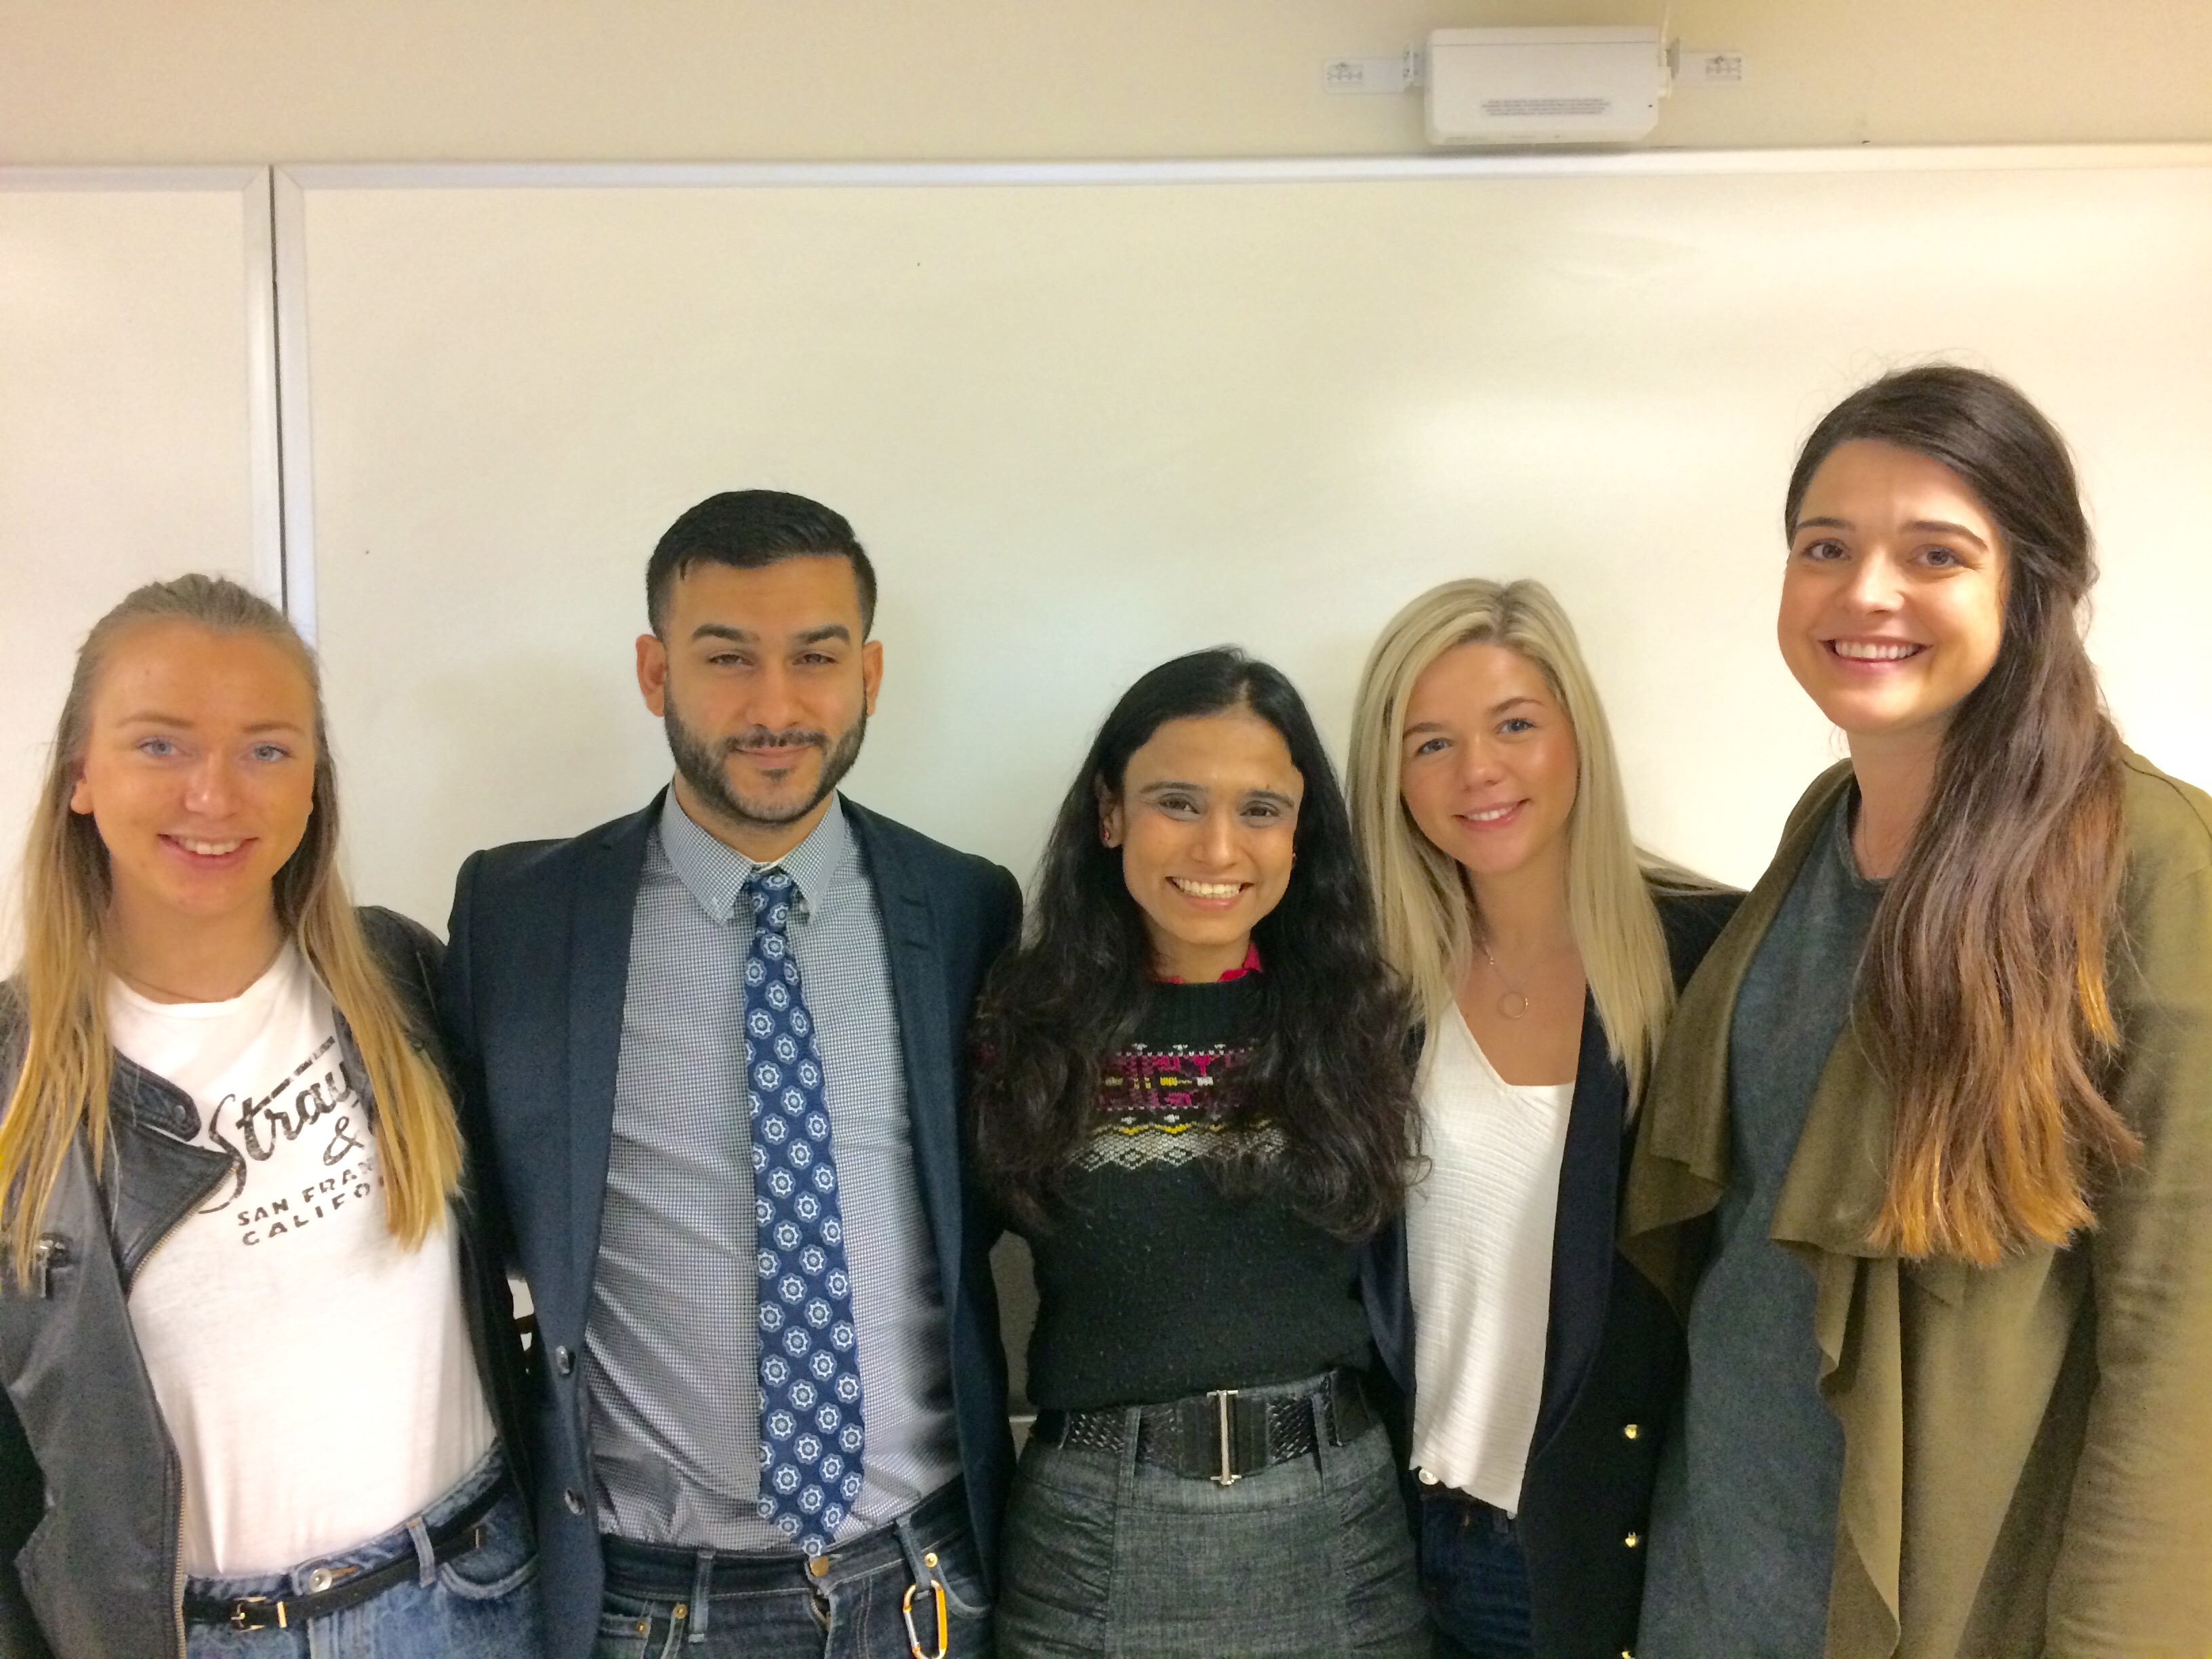
In winter 2016, we piloted a new project-based elective course, “Data Analysis and Decision-Making,” to introduce students to the fast-growing field of business analytics. The emphasis was placed on creating data stories and the use of analytical software to transform the way students think about data and the information-driven world in which they live.
We observed that sometimes highly quantitative subjects can be tedious and overwhelming if students are required to perform meaningless intellectual gymnastics in a traditional classroom environment.
To engage Berkeley College undergraduate students with real-world challenges while introducing them to the world of applied analytics, the class participated in a consulting project for the B4P Foundation.
New Types of Collaborations Create Strategic Opportunities
The B4P Foundation is an organization that aims to promote sustainable development in challenged regions by supporting businesses of peacekeeping and humanitarian efforts entering new markets, contributing to economic prosperity and creating hope – the building blocks of long-lasting peace. These new markets are often outside the comfort zone of many decision-makers who steer investments and market orientation.
To make such strategic decisions to engage in new markets full of opportunities, but also many uncertainties, businesses need data that can be derived and explained through modern analytics decision-support tools designed with a deep understanding of the business factors that really matter.
The Berkeley College students’ consulting project aimed to apply analytics and data science to develop a proof of concept and a working prototype of a decision-support tool that would empower businesses to implement sustainable development goals. Thus, the objective was not just to apply tools and methods that analyze complex data or create a new data model, but also to provide data-driven information that facilitates conscious and informed decision-making.
To enable the visual analytics needed for the project, we leveraged Tableau software. Tableau is a leader in the Gartner Magic Quadrant for Business Intelligence and Analytics Platforms for the fifth consecutive year. As a part of their Academic Program, Tableau provided us with student licenses of the software, business analytics curriculum material and innovative resources.
(Next page: A systemic approach; hands-on methods for analytics)
Systematic Approach Implemented in Stages
To address the client needs, the project was divided into three stages: Understanding business decision–making and data source selection; Data analytics modeling and evaluation; and Transformation of data into decision–supporting information.
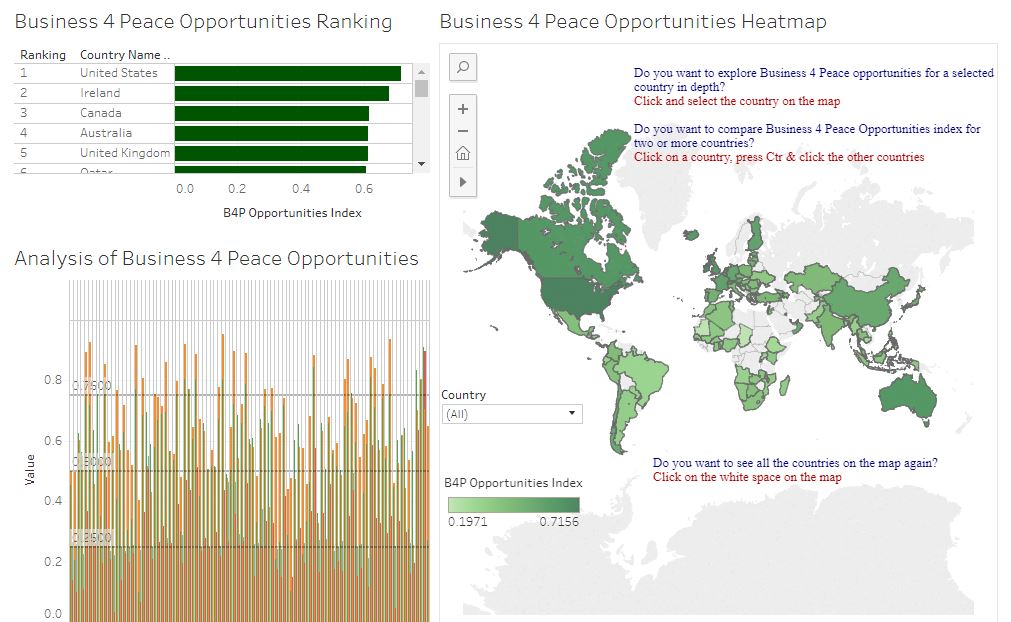
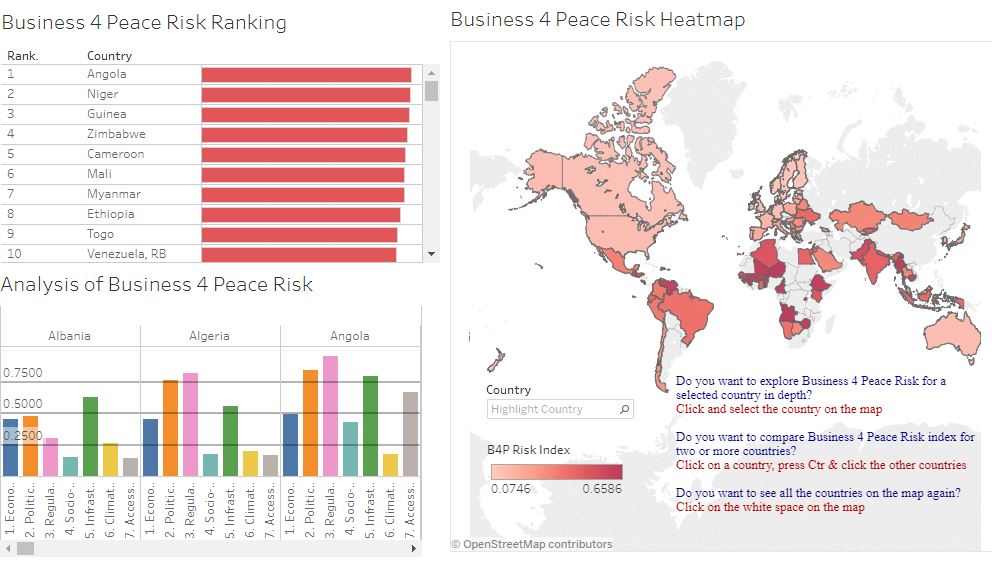
In the first stage, two student teams, the opportunity index team and the risk index team, conducted research to study the business factors and related data indicators that matter in market-entry decisions, as well as selecting the data sources to be analyzed. At the end of the first phase, the student teams developed two multi-dimensional indices: a Business for Peace Opportunity Index and a Business for Peace Risk Index.


They also prepared detailed reports documenting the key constructs, indicators, and relevance.
In the second stage, the teams conducted extensive data mining, wrote queries to extract indicator data from open datasets from multiple sources, joined the datasets together, filled data gaps and made it ready for the final stage.

In the final stage, students applied analytics to create innovative visualizations, dashboards, and data stories. A working prototype of the index was published via Tableau and is accessible for viewing online here.

Hands-on Methods Provides Momentum
A key success factor was the close interaction among Berkeley College students and our sponsor, B4P Foundation. This strong collaboration allowed the students to obtain quick feedback, experiencing how it is to work for a real client facing a real-world challenge, and finding answers to questions that matter. As a result, the applied methodologies and analytics went far beyond what a traditional classroom problem set can create.
The initiative was not only valuable in terms of student engagement, retention, and persistence, but also in meeting the clients’ needs. “This project produced outstanding work,” said Axel Weber, chief analyst at the B4P Foundation. “Focusing on interactive data visualization using Tableau, and a very innovative data mining approach, the results of this project differentiates it from traditional business intelligence and analytics by delivering information not only fast, but by removing complexities, and by being intuitively understandable by clients and decision-makers.”
This type of innovative approach to analytics education engages and empowers Berkeley College students for success, enables them to make a meaningful impact in the world, and bridges the disconnect between the demands of the real world and the higher education system.
- Survey: More students want to go to graduate school - April 24, 2024
- Educause, AWS launch generative AI readiness assessment tool for higher ed - April 23, 2024
- A bungled FAFSA rollout threatens students’ college ambitions - April 19, 2024

